The research station shown in the photo consists of an IRS336 - NDT camera, a heat source (2x500W halogen lamps), and a desktop computer with IrNDT thermal imaging software installed. A DAQ data acquisition card (NI USB – 6251) is connected to the desktop computer. Additionally, an AT IRXBOX hardware module was installed for hardware triggering of thermogram recording and acquisition of thermal stimulation sources.
The thermal imaging camera is attached to the MagCam magnetic field camera station. This station consists of a magnetic field camera, a table with movable X, Y, Z axes and a desktop computer with software.
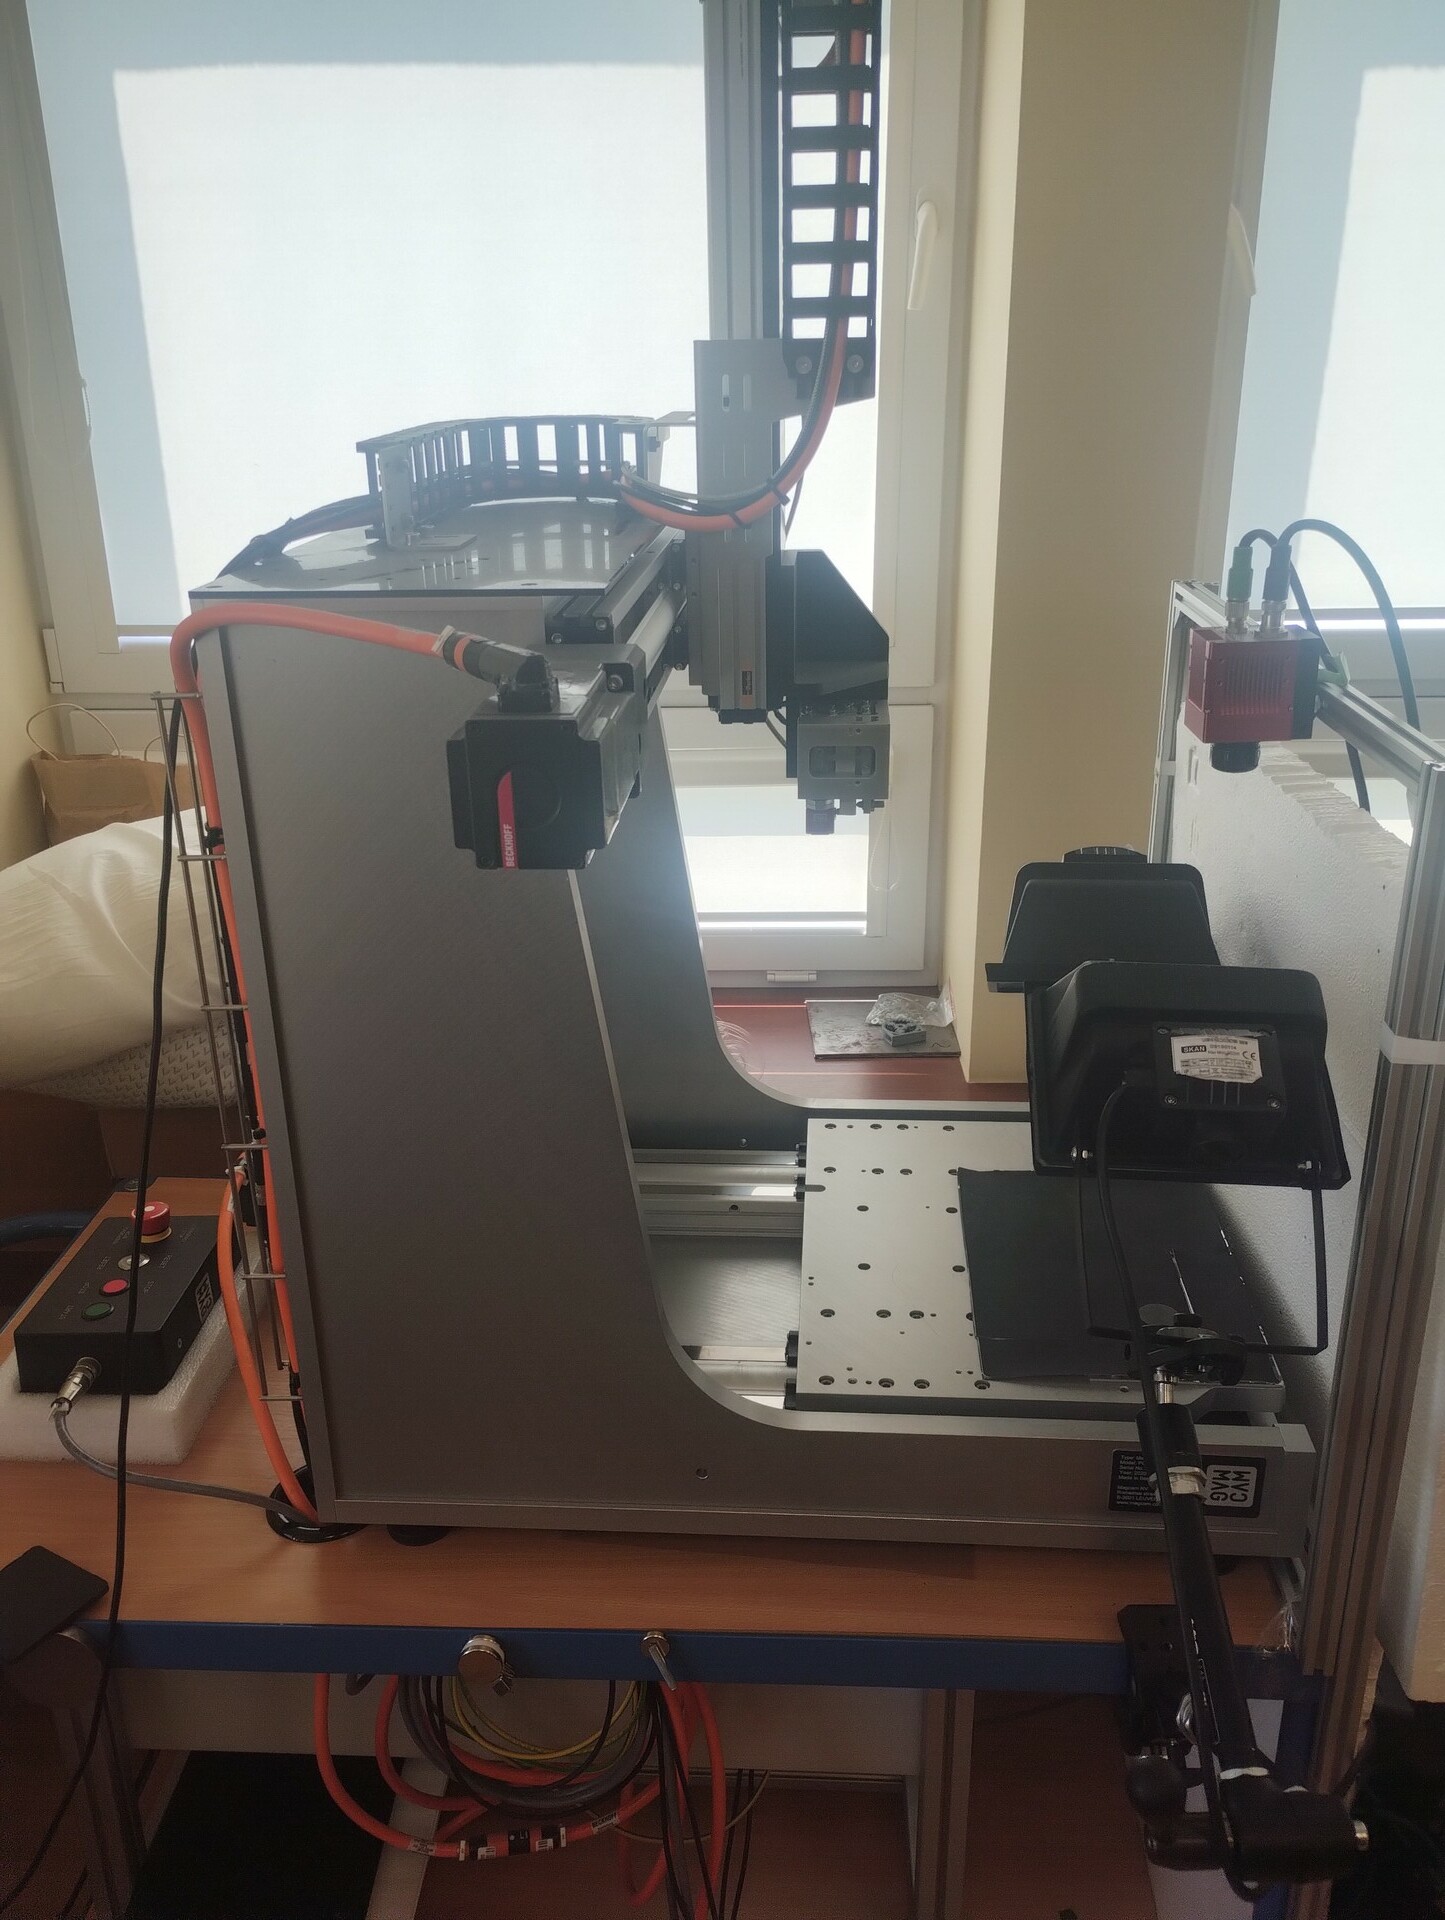
Fig.1. Measurement stand consisting of MagCam magnetic field camera, IRS336 thermal imaging camera and thermal forcing source
Experimental tests were carried out on composite samples made of iron powder mixed with polyvinyl chloride (PVC) in various proportions. The photos show exemplary composite samples with a composition of 75% Fe + 25% PVC (a,b,c) and 25% Fe + 75% PVC (d).
1. reference composite sample (a)
2. composite sample with inclusions of 3 mm thick transformer sheet (b)
3. composite sample with inclusions of 4 mm thick transformer sheet (c)
4. Composite sample with PVC inclusion (d)
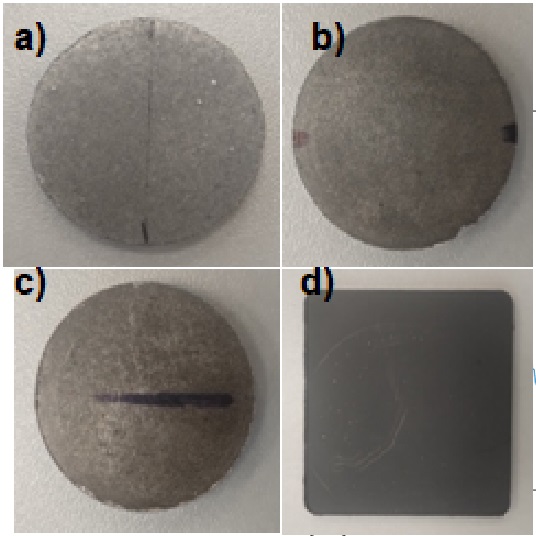
Fig.2. Composite samples
As a result of the research, magnetograms and thermogram sequences were obtained, which were used for further analysis.
The gallery presents sample test results of a reference sample and a composite sample with a 4 mm inclusion.
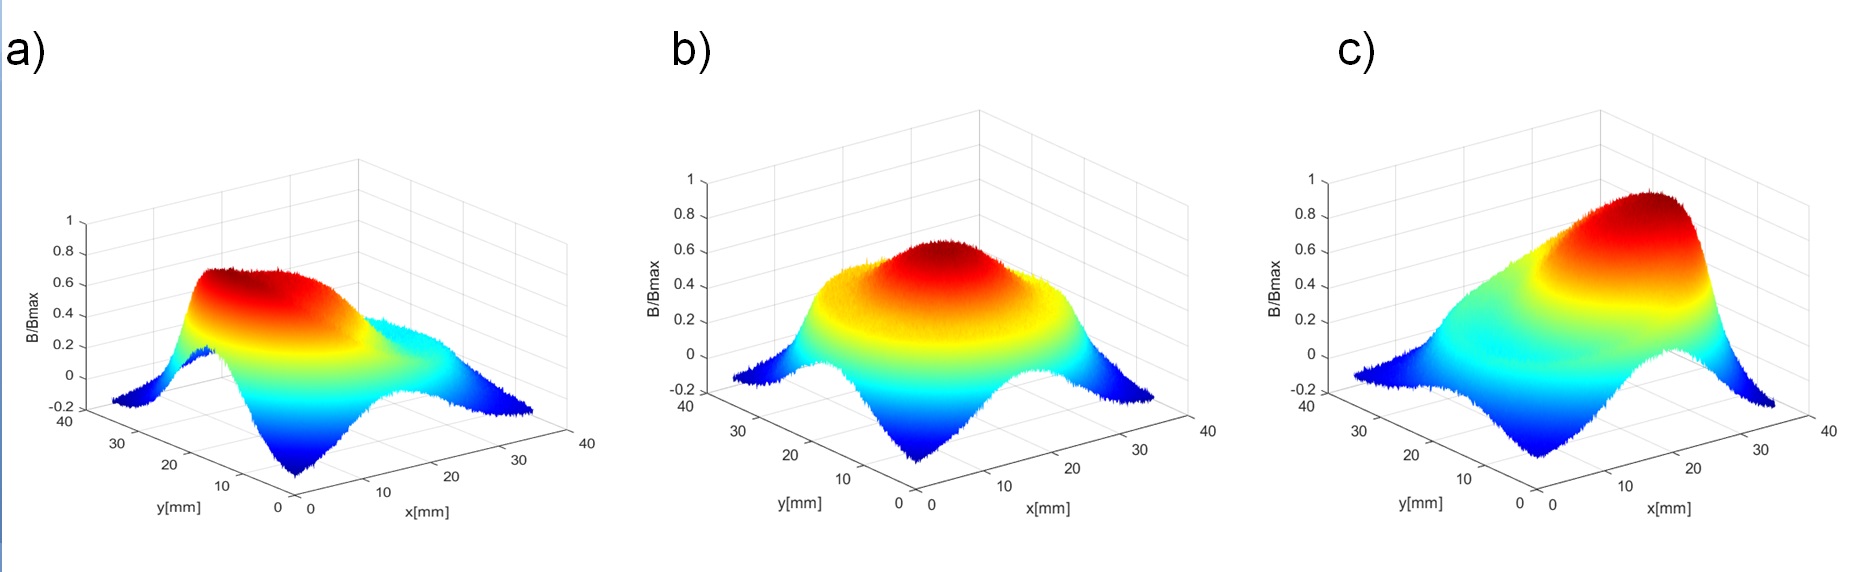
Fig.3. Image of the magnetic field over the surface of the reference sample, (a) magnetic forcing on the left, (b) magnetic forcing in the middle, (c) magnetic forcing on the right
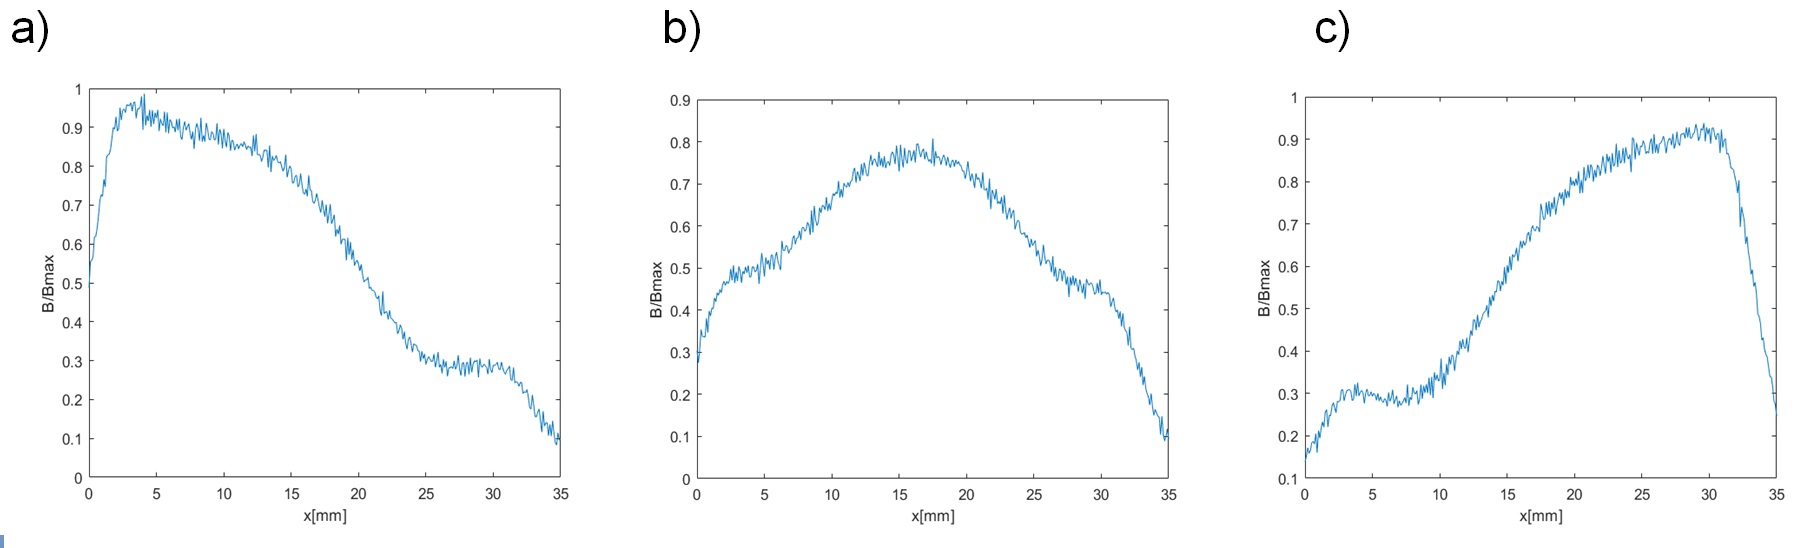
Fig.4. Distribution of magnetic induction over the surface of the reference test sample parallel to the X axis, dal Y = 17.5 mm, a) magnetic forcing on the left, b) magnetic forcing in the centre, c) magnetic forcing on the right
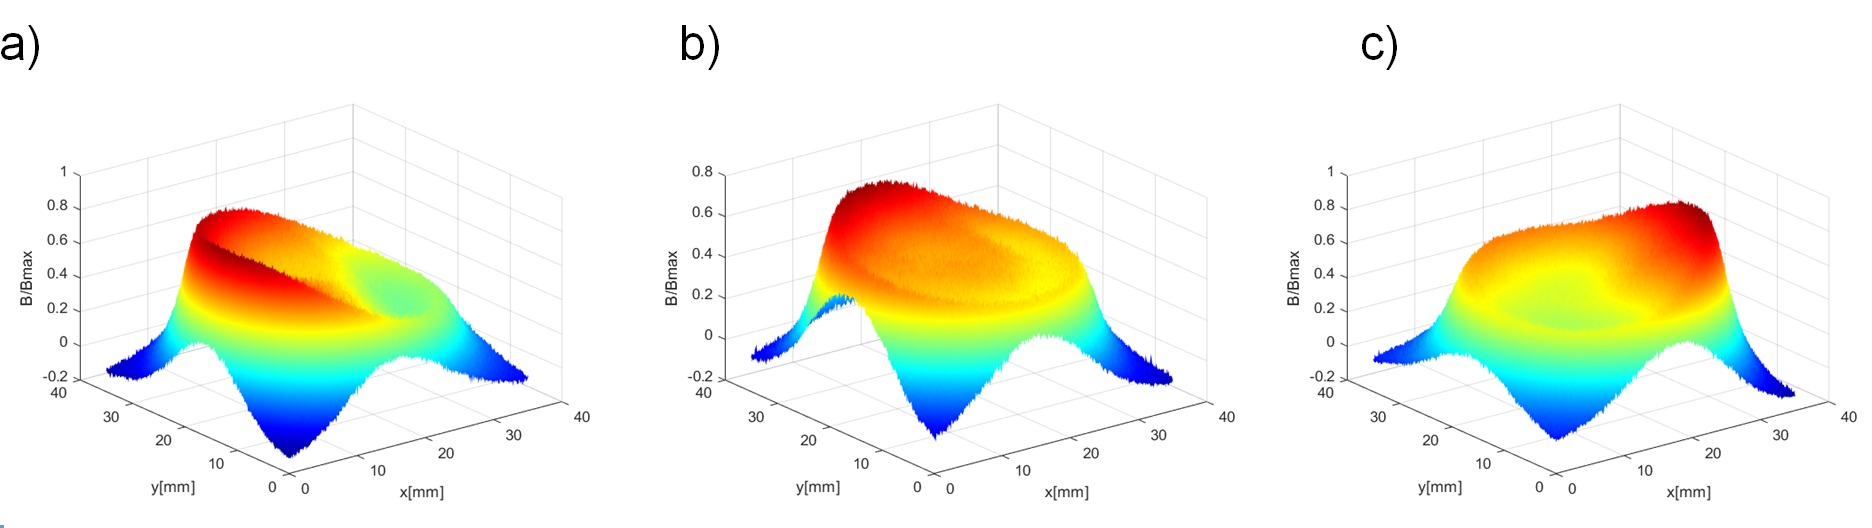
Fig.5. Image of the magnetic field over the surface of a specimen with a 4mm thick electrotechnical sheet inclusion, (a) magnetic forcing on the left, (b) magnetic forcing in the centre, (c) magnetic forcing on the right
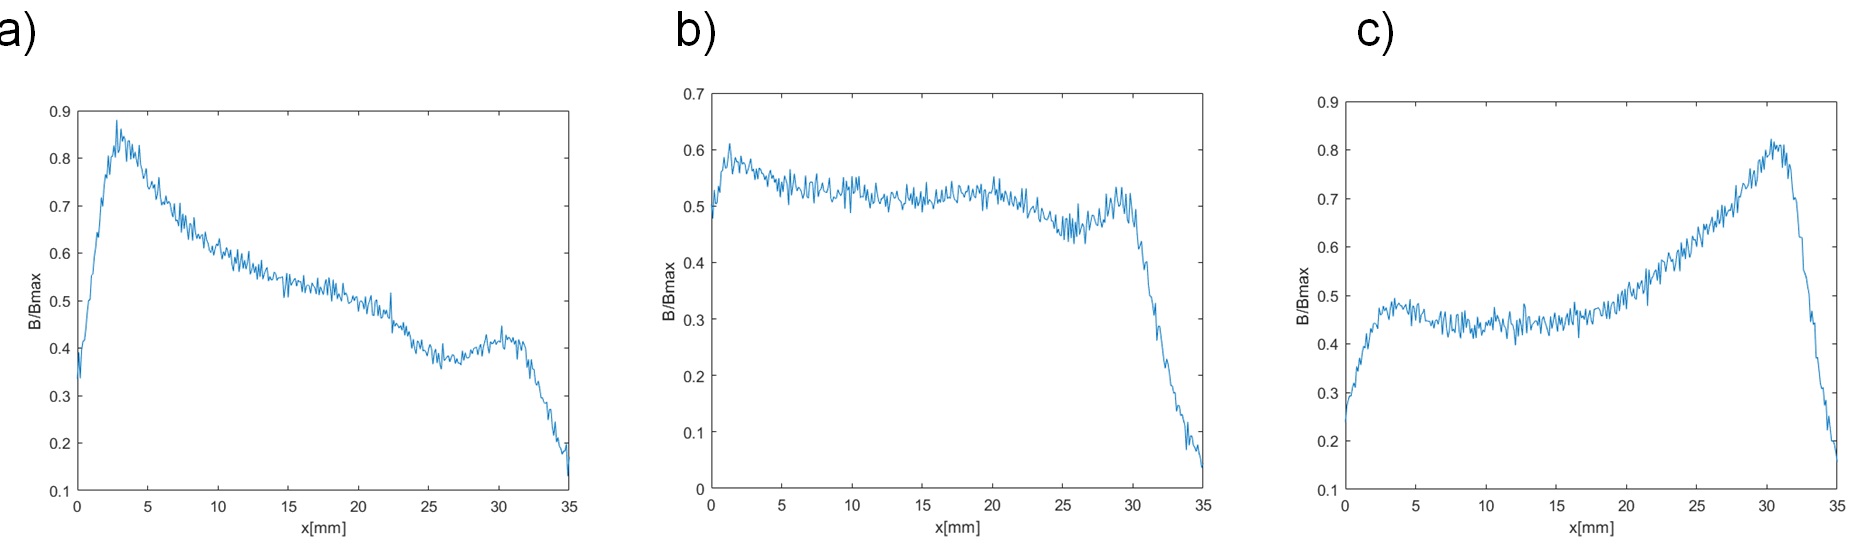
Fig.6. Distribution of magnetic induction over the surface of the test specimen with a 4mm-thick electrotechnical sheet inclusion parallel to the X axis, dal Y = 17.5 mm, a) magnetic forcing on the left, b) magnetic forcing in the centre, c) magnetic forcing on the right
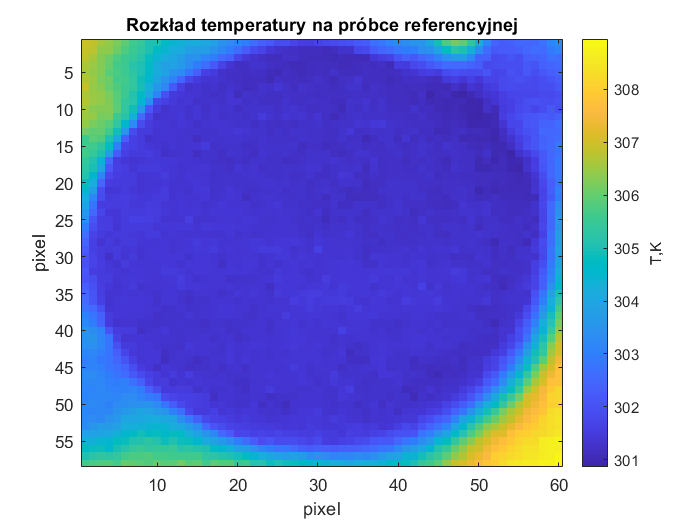
Fig.7. Temperature distribution on the reference sample
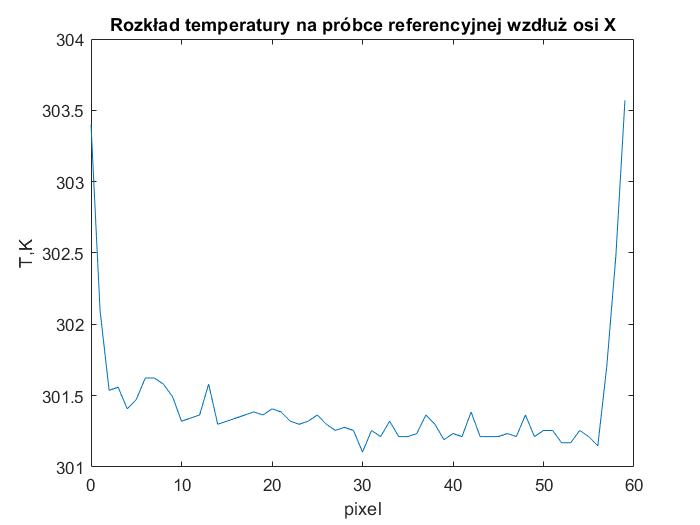
Fig.8. Temperature distribution on the reference sample along the X axis
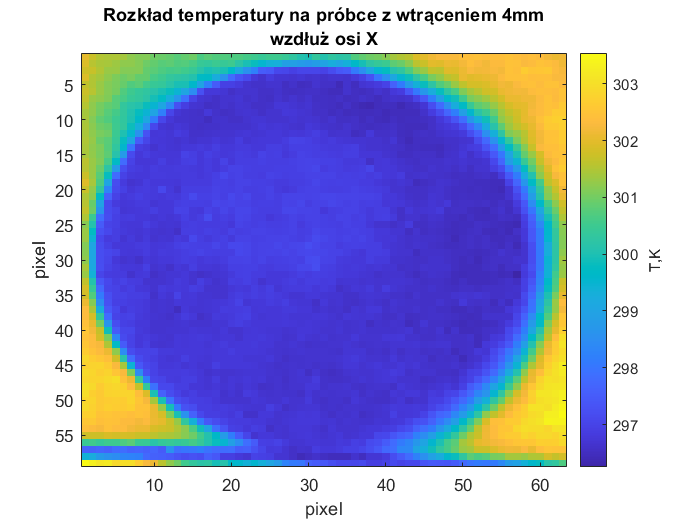
Fig.9. Temperature distribution on a 4mm thick electrotechnical sheet insertion specimen
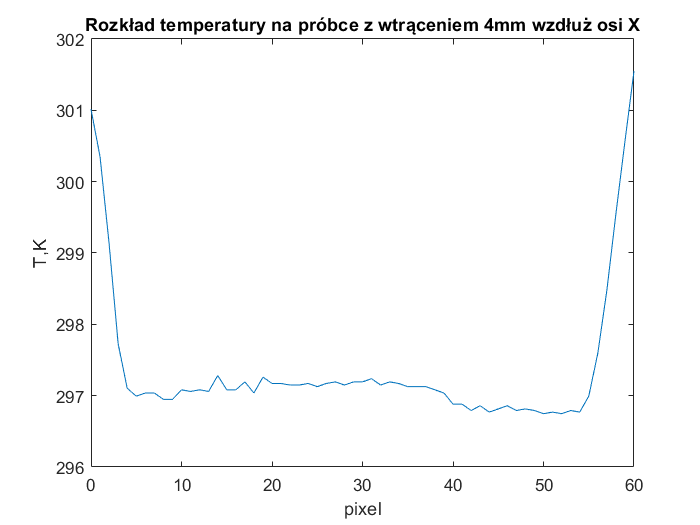
Fig.10. Temperature distribution on a 4mm thick electrotechnical sheet insertion specimen along the X axis
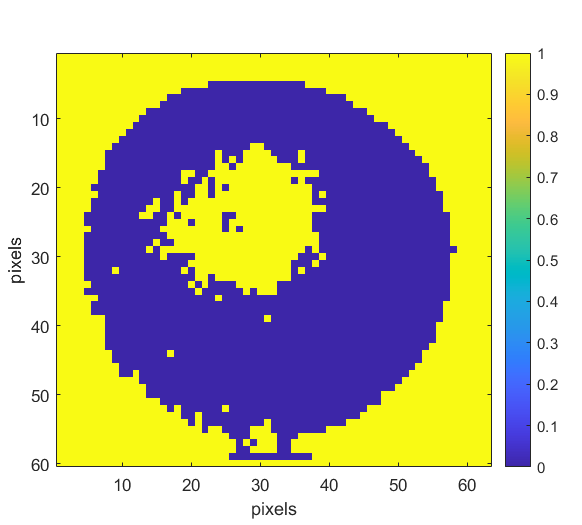
Fig.11. Binarisation result of a thermogram of a 4mm thick electrotechnical sheet insertion sample using the local thresholding method (Tau = 2 s, median method, s = 0.5, nbsize = 51x51 pixels)
Copyright © Politechnika Częstochowska. Wszystkie prawa zastrzeżone.
 Politechnika Częstochowska uczelnią dostępną.